
Turn pipeline data into management decisions
Sales Reporting and Forecasting Software
Delbig sales reporting software combines open, won and lost opportunities by value, probability, expected close date, source, customer and owner. A probability-weighted pipeline is calculated from current opportunity records to keep sales planning in one shared view.
See pipeline and weighted sales forecast together
Alongside total open pipeline, Delbig shows a weighted value calculated as opportunity value × probability. This keeps total potential distinct from probability-adjusted expected value.
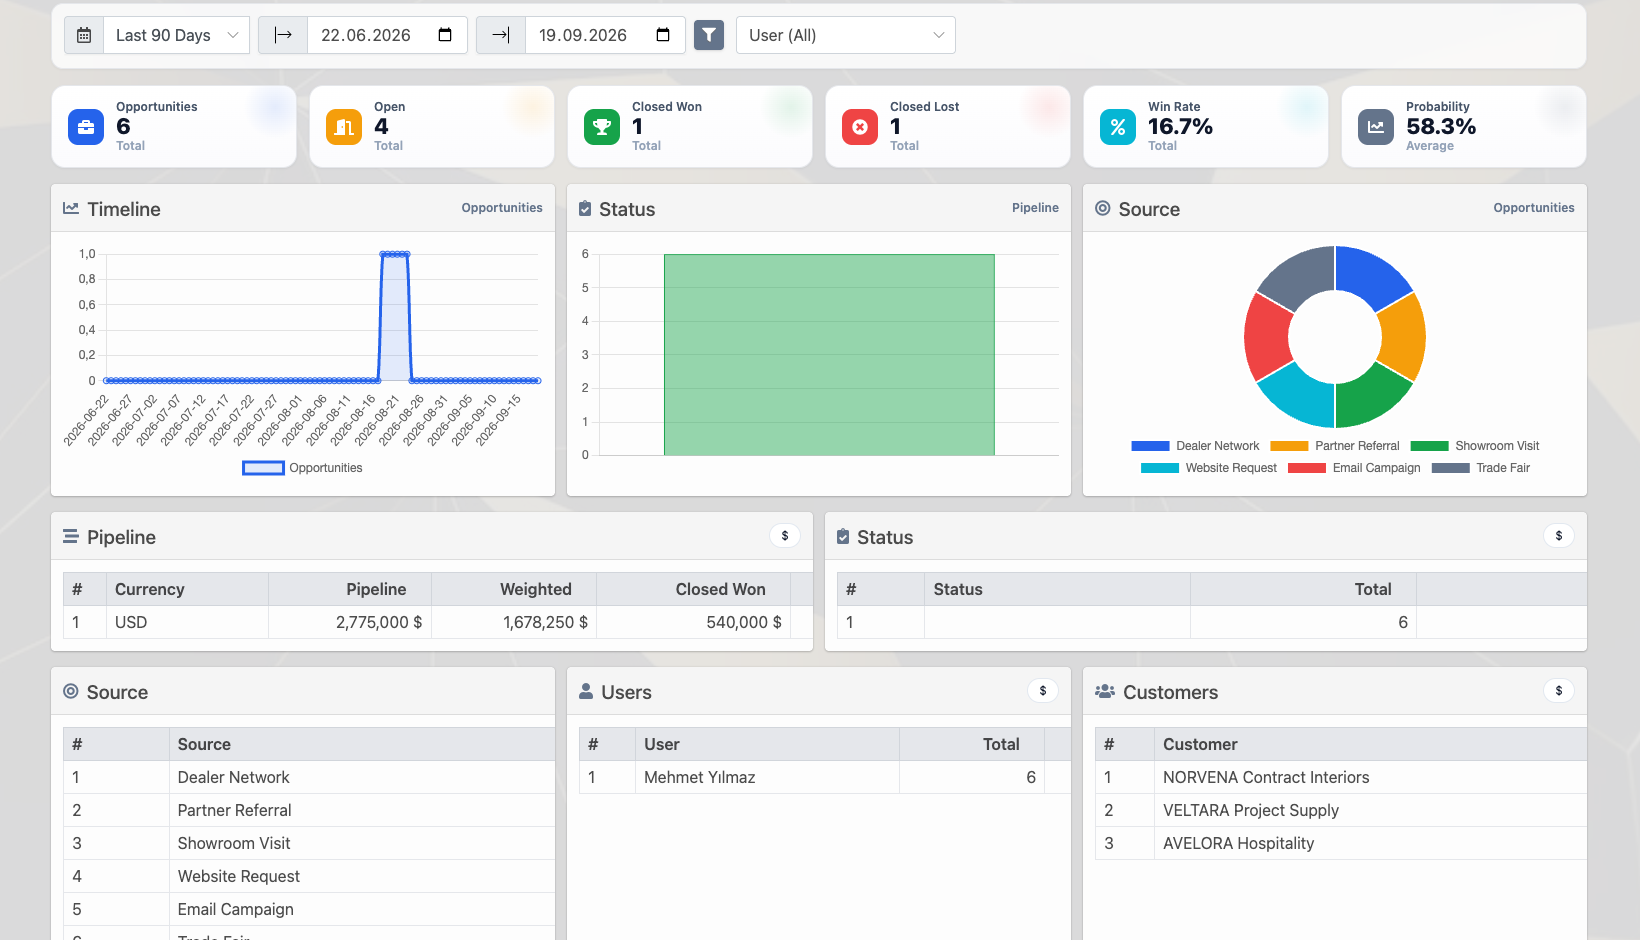
Track win rate, probability and sales sources
Open, won and lost opportunities are reviewed with average probability, win rate, timeline and source distribution.

Compare team and customer performance
Owner, customer, source and currency breakdowns reveal which channels and team members create stronger opportunities; relevant reports can be exported to Excel.
Manage the forecast with current sales data
This is not an automatic statistical or AI prediction. Reliability depends on the team keeping opportunity value, probability, status and expected close information current.
Frequently asked questions
How is a weighted sales forecast calculated?
Each open opportunity value is multiplied by its win probability, then values in the same currency are totalled.
Is the sales forecast generated by AI?
No. The forecast described here is a transparent weighted pipeline calculated from the current opportunity values and probabilities recorded in the CRM.
Which sales reports are available?
Teams can monitor open, won and lost opportunities, win rate, average probability, source, owner, customer, aging and currency breakdowns, with Excel export for relevant tables.
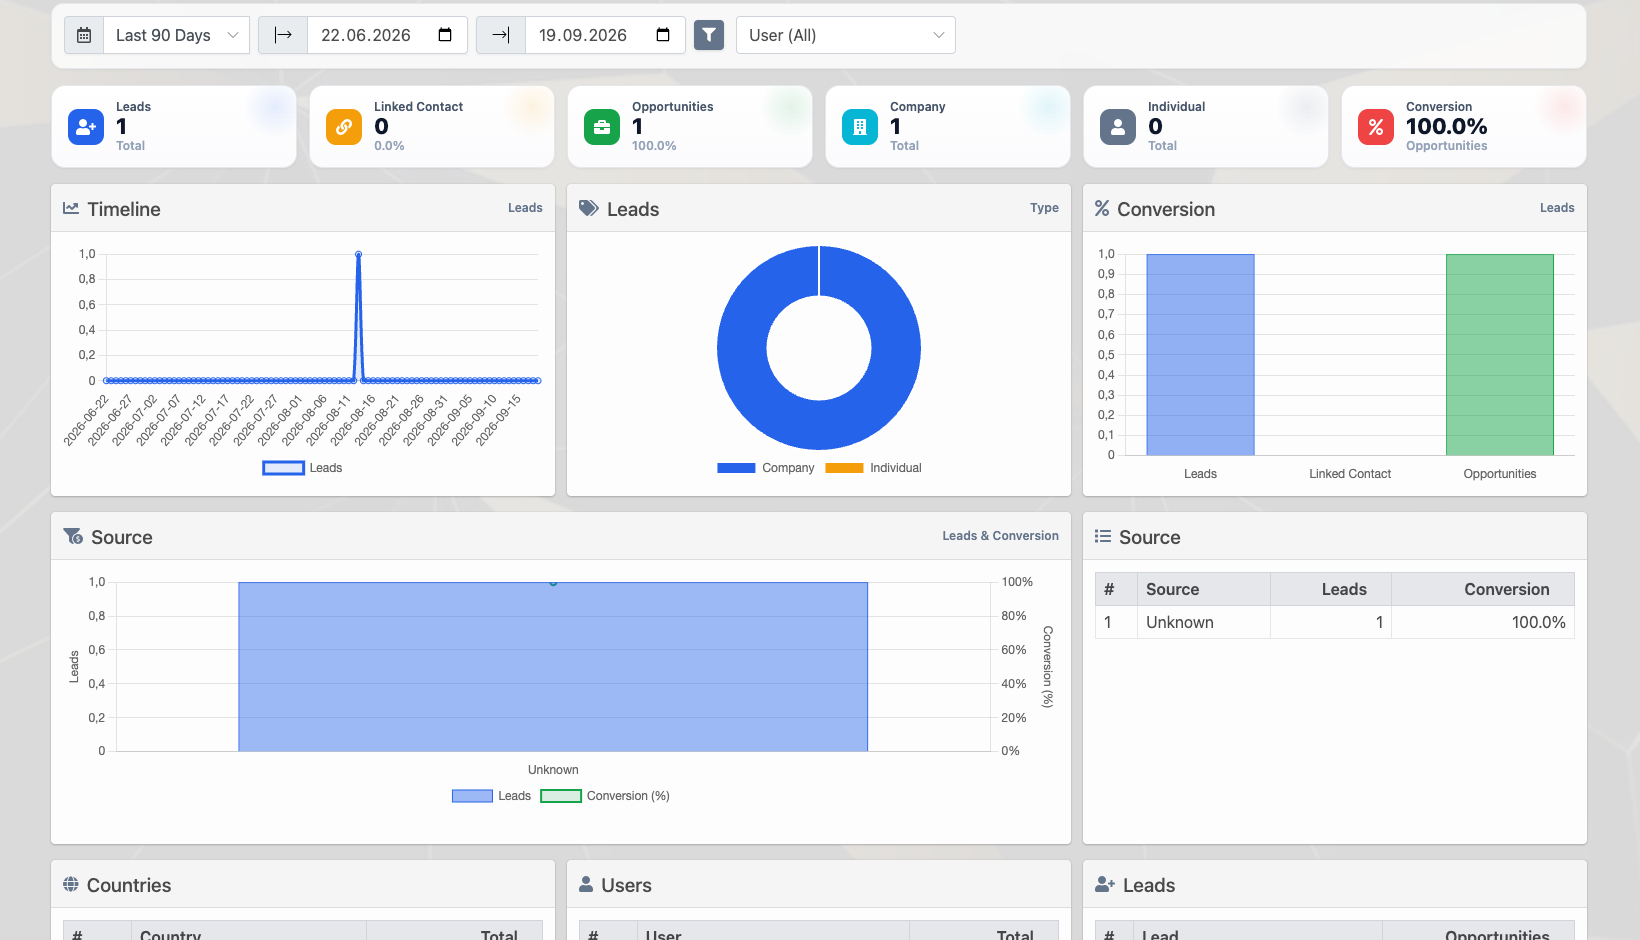
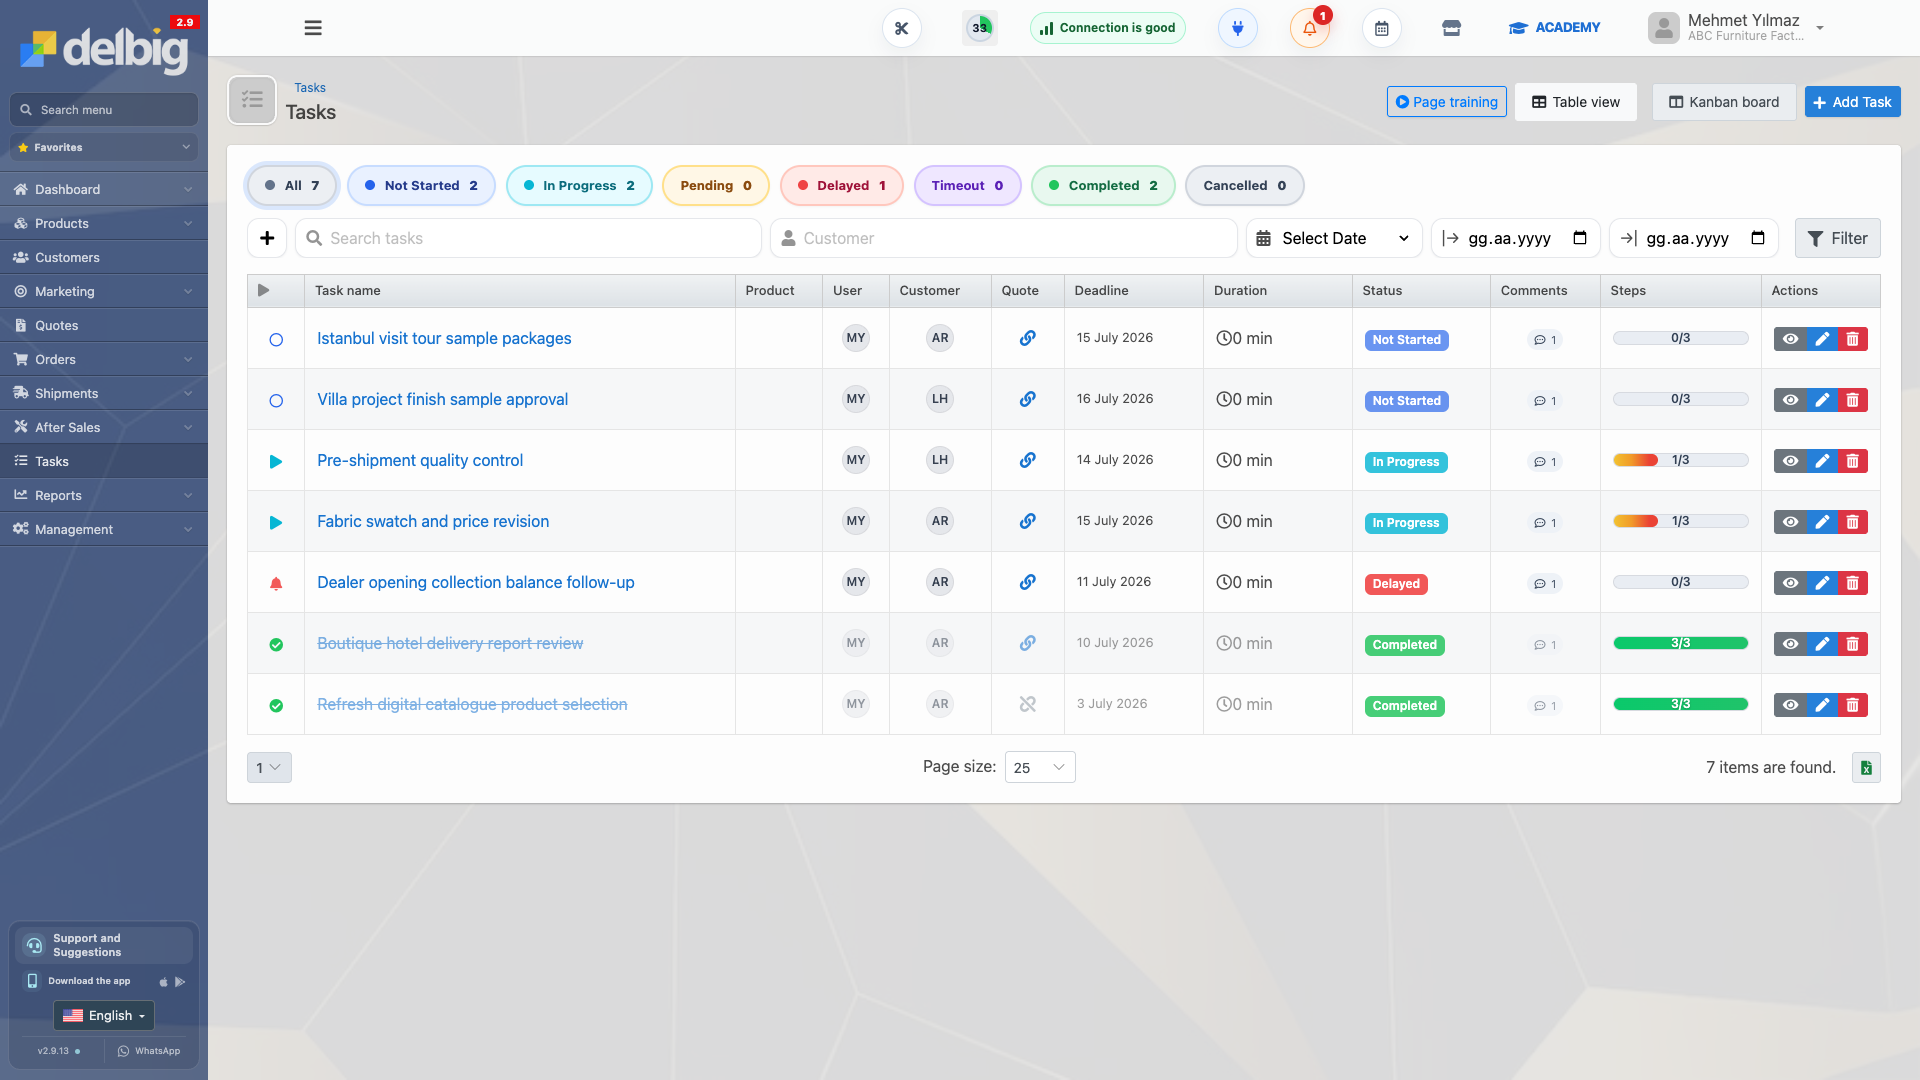
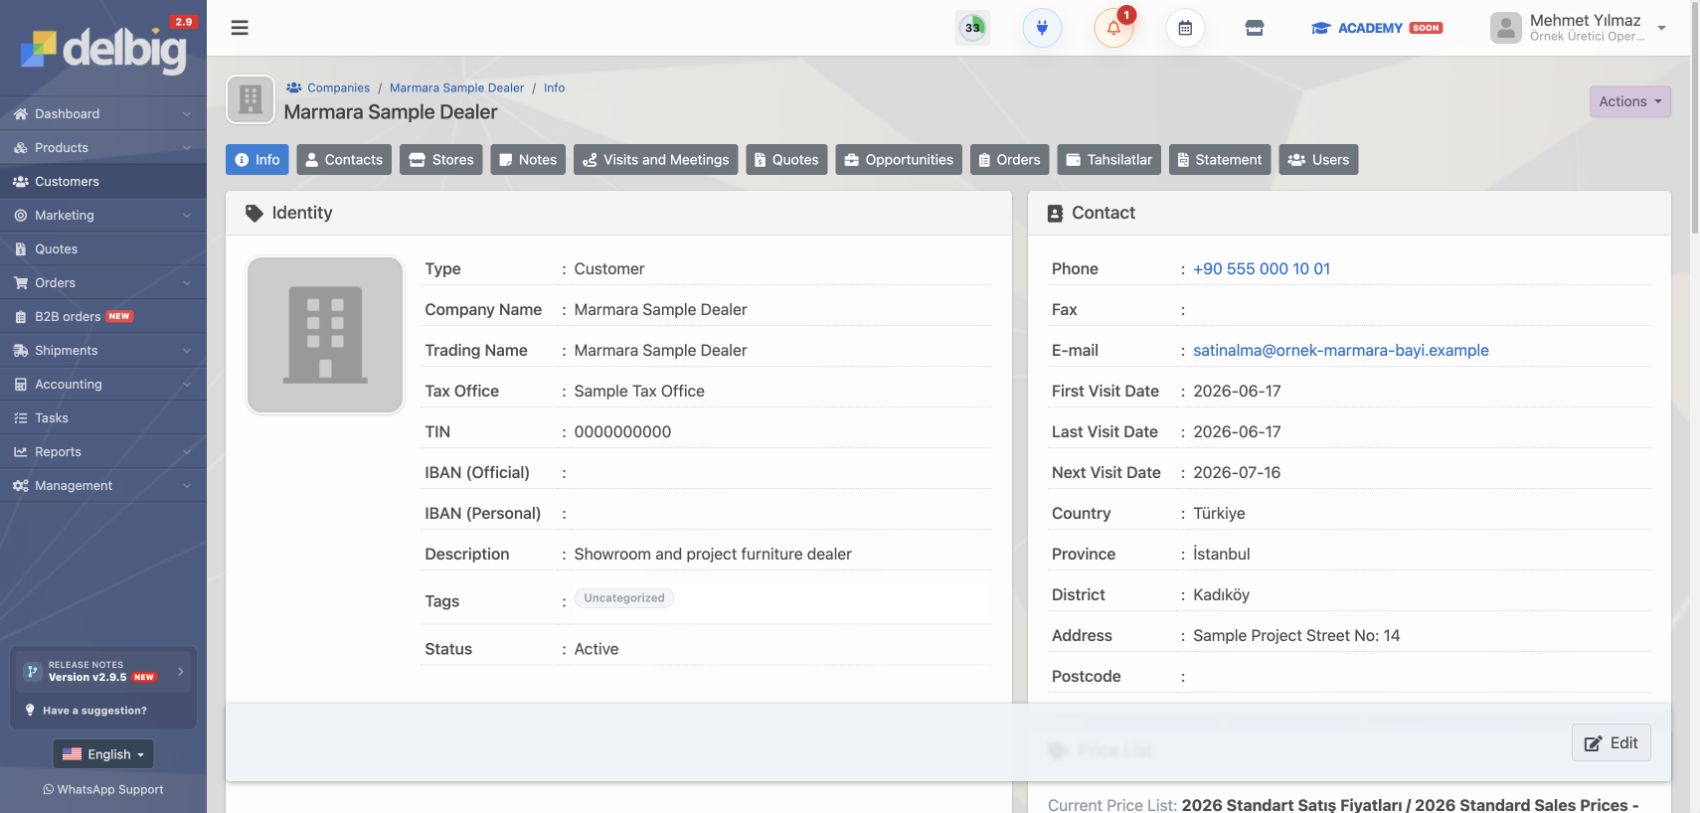
More real product screens

Define your sales reporting model with Delbig
Share your opportunity stages, probability method and management reports; we will map a measurable pipeline view together.